Showing posts with label Query Tuning. Show all posts
0

Query Tuning (Part 5 - Which Queries Should I Tune?)

Posted by Danielle Smith on 12:31 in
Hi everyone! Hope you all had a great weekend! Today's blog post marks the end of my Query Tuning series.

You can find previous parts of the series here:

Query Tuning (Part 1 - Evaluating Query Performance)
Query Tuning (Part 2 - Query Execution Order)
Query Tuning (Part 3 - Graphical Execution Plans)
Query Tuning (Part 4 - Ways To Improve Your Query Performance)

Now you have determined possible "problem" query parts, you should now investigate this one step further by analysing the query as it runs and using the Database Tuning Advisor.

Firstly, in order to effectively determine which queries need tuning, you should use the SQL Server Profiler tool. This will listen out for all queries run against that particular database instance, though you will probably want to look out specifically for SQL:BatchCompleted and RPC:Completed. You can also choose which columns to retrieve and the following are most useful when it comes to database tuning:

  • Duration - Returns the speed of the event in milliseconds.
  • Reads - Returns the number of page reads during execution.
  • Writes - Returns the number of page writes during execution.
  • CPU - Returns the amount of time used by the CPU. 

If any of these columns have particularly high values in them, that's when you should investigate further. You can create trace files using the SQL Server Profiler and then query against them.

The Database Engine Tuning Advisor

You can use the Database Engine Tuning Advisor to give hints as to what could benefit from being tuned. Note that these are only a recommendation however, and that some instances can actually make your data run slower. Therefore it's imperative that you do your investigations first.

In order to run the Tuning Advisor:

Open SQL Server Management Studio and click on Tools > Database Engine Tuning Advisor:


Next, select the database instance you are working on and click connect. This will give you a list of all of the databases found on that server instance.

You will need to choose a work file in order to tune your database tables. For this example, I am going to use a very simple SELECT statement against my Asset Table:


I saved this query onto my Desktop to make it easier to find. Under Workload (and making sure that the radio button is set to File) I selected my script to be analysed and set the database for workload analysis to my database "DaniellePractice".



Next, select the tables that you wish to run your query against. For this example, I want to select my Asset table:


Once you are happy with your selection, take a look at the Tuning Options by clicking on the appropriate tab at the top of the screen. I am going to use the default settings, however it's useful to get familiarised with what they are and what can be changed in order to influence your results:

When you're happy with your settings, click on the Start Analysis button:


You will see the following screen appear:


This indicates that your tuning analysis has started. Once all 5 stages are complete, you will see a list of recommendations on ways that you can tweak your query and database in order to make them both run faster.

This is just a simple example to show how to use the Tuning Advisor, but I have used it previously in a larger project. A refresh cache button appeared to be timing out. So I used SQL Server Profiler to capture the refresh query, saved the script and then ran the script in the Tuning Advisor against the tables which the refresh cache would have impacted. I discovered that I was right; the query was taking longer than the 30 second time out cap. In order to rectify this, I experimented by adding in the recommendations one by one to find the optimum speed. Once all relevant indexes and statistics were added, the button worked perfectly! It's all about practice.

What Next...

So this nicely moves us along to my next blog post on indexes and partitioning, which will be a rather large topic to cover fully, so this will be broken down into parts as well. Indexes and partitioning are very important as they can help speed up your slow database queries.

As A Final Word...

Thank you for reading today's blog post! If you have any questions/comments/feedback, please leave them in the comments section below and I will get back to you as soon as I can. Alternatively, please like my SQL Genius Facebook Page and leave a message on there.

0

Query Tuning (Part 4 - Ways To Improve Your Query Performance)

Posted by Danielle Smith on 12:17 in
Hi everyone! Today's blog post will be focused around ways to improve your query performance and is part of my Query Tuning series.

You can find previous parts of the series here:

Query Tuning (Part 1 - Evaluating Query Performance)
Query Tuning (Part 2 - Query Execution Order)
Query Tuning (Part 3 - Graphical Execution Plans)

Now you have discovered that your queries are running slower than expected, you are aware of the theoretical query execution order and you have pinned down what exactly is causing the issue using the Graphical Execution Plans. The next step is to discover how to go about fixing the problem! The purpose of today's blog post is to explain in more detail what impacts performance and how you can avoid these situations from the offset. 

Search Arguments

Search Arguments are filter expressions that are used to limit the number of rows brought back as part of a result set. Search arguments are capable of using index seek operations, which greatly improve the performance of your query.

Note that for these examples, I put a non-clustered index on the column first using the following code:


An example of a query without using search arguments is:


This example uses the OrderDate column as an expression and produces the following execution plan:


However, note that if your filter expression isn't a search argument and none exist within the query, you will be using an index or table scan, which actually slows down performance. Be very careful! An example of the above query rewritten to boost performance is shown below:


Now the query above doesn't use AssetDate as an expression, it just does a comparison. The following execution plan is produced:


Make sure that you choose how you write your queries with care as these queries bring back exactly the same results but are implemented in different ways, yet one has much better performance than the other.

Joins

As you noticed in the blog post yesterday, using JOINs really can slow down your queries, especially if you are using OUTER JOINS. The best way around this problem is to reduce the number of JOIN clauses (WHERE and ON) to as few as possible. However, if this is not a viable solution you will have to seriously consider which JOINs you are using and try to use as few OUTER JOINs as possible.

Subqueries

Self-Contained Subqueries

Seeing as Self-Contained Queries do not rely on the outer query in order to bring back results, it means that there is very little query cost involved in executing them. 

Correlated Subqueries

However, correlated subqueries do rely on the outer query and if the outer query is returning a lot of rows, it means that the subquery is going to be processed many times in order to produce the final result set.

In order to avoid this from happening, try to use Self-Contained queries. However if that's not an available solution, use the ROW_NUMBER function instead. This way, you can find the exact amount of returning rows you need. However do note that if you do use the ROW_NUMBER function, it needs to be placed within a Common Table Expression.

User-Defined Functions

Scalar User Defined Functions

Scalar UDFs are not included in a graphical execution plan, so can be a hidden factor making your queries slow down. Make sure these are accounted for by using SET STATISTICS TIME ON in order to measure the total execution time. If you have optimised as much of the rest of the query as possible yet the time it takes for your query to run is still slower than expected, then it could be your User Defined Functions that are causing the problem. 

Table-Valued User Defined Functions

There are 3 different types of Table-Valued User Defined Functions which I have discussed in a previous blog post. To recap, they are:

  • Inline 
  • Multi-line
  • CLR 

They all perform in different ways, therefore their individual query costs will vary greatly.

Inline

An Inline Table-Valued UDF is basically an optimised view that accepts parameters. Therefore, they run very quickly.

Multi-statement

A Multi-statement Table-Valued UDF works similarly to a stored procedure that populates data into a temporary table before querying against it. This means that if you're returning a large data set, that data set will need to be processing into a temporary table before any actions are performed against it.

CLR

A CLR Table-Valued UDF streams the result set as soon as it becomes available. This means that an outer query doesn't have to wait for the entire result set to be returned before it can start processing, it starts processing as soon as the first data row becomes available.

Typically, Inline statements are the best to use, followed by CLR and then Multi-statement. Try to write as much of your code as Inline as possible in order to make your queries that much faster.

Cursors

Generally, you should try and avoid using cursors as they have a big impact on performance. This is because they perform a minimum of a SELECT on every single row in the data set, which is very costly especially if you have many rows in the table. Instead, try to use set-based statements however if this isn't viable, try using a table-valued user defined function or a CLR stored procedure.

What Next...

You've tried to keep all of this in mind, yet still your queries are running slower than expected so what do you do next? My final blog post in this series is about using SQL Server Profiler and the Database Engine Tuning Advisor in order to capture those troublesome queries and easily tweak them to make them quicker, tools which I have found invaluable in the work place. Stay tuned!

As A Final Word...

Thank you for reading today's blog post! If you have any questions/comments/feedback, please leave them in the comments section below and I will get back to you as soon as I can. Alternatively, please like my SQL Genius Facebook Page and leave a message on there.

Happy Friday everyone :) Hope you all have a great weekend! 

0

Query Tuning (Part 3 - Graphical Execution Plans)

Posted by Danielle Smith on 12:30 in
Hi everyone! Today's blog post will be focused around Graphical Execution Plans and is part of my Query Tuning series.

You can find previous parts of the series here:

Query Tuning (Part 1 - Evaluating Query Performance)
Query Tuning (Part 2 - Query Execution Order)

Now you have discovered that your queries are running slower than expected and you now have a grasp on the query execution order. The next step is to discover what exactly is causing the problem.

In order to do this, we use what is called Graphical Execution Plans, which is a graphical representation of the query as it has been executed. The purpose of this blog post is to explain how to successfully read and interpret these plans with examples.

Things To Be Aware Of

When looking at your plan, there are particular items that you should really look out for. These have been included in the table below (referenced from Microsoft SQL Server 2008 - Database Developer Training Kit: MCTS Exam 70-433 p 196-197, ISBN: 978-0-7356-2639-3): 


Examples of Graphical Execution Plans: 

Firstly, make sure that you have Actual Execution Plan included by right clicking and selecting "Include Actual Execution Plan" as highlighted in the screenshot below (or alternatively you can use the shortcut Ctrl+M): 


This will ensure that when you execute each of the queries, the plan will be generated as a separate tab along with the result set and system messages. Note that in some of these will be rather small on the blog itself so you will need to click on them in order to maximise them and see the image clearly. 

SELECT FROM TABLE

Query: 


Output: 

Performing a straight unfiltered SELECT on a table is the quickest query you will ever run. As you can see, the performance on the one below really can't be improved. 


For more information on each of the operations in the Execution Plan, just hover your mouse over the operation you wish to look at, as shown in the screenshot below: 


As you can see, a list of both actual and estimated costs are displayed. Generally, the higher the costs, the longer it will take for the query to run and bring back results. 

SELECT FROM VIEW


Query: 


Output: 

Performing a SELECT statement on a View will obviously take longer than a straight SELECT from a table as it contains JOINs to other tables and is returning those results as well.


JOINS 

In the examples below, take a look at how the performance of each query differs depending on the type of join used.

LEFT JOIN

Query: 


Output: 


RIGHT JOIN 

Query: 


Output: 


INNER JOIN

Query: 


Output: 


FULL OUTER JOIN 

Query: 


Output: 

As you can see, a FULL OUTER JOIN has many more operations, therefore return results slower than any of the other kinds of JOIN that I've looked at.


INSERT (Simple)

This is just a simple INSERT statement which is inserting data into a table which will have no impact on any other processes in the database.

Query: 


Output: 

All processes for this query are focused around the INSERT itself. 


INSERT (Complex with Stored Procedures attached)  

Now let's take a look at an INSERT statement which has other implications attached to it that run as a direct result of updating that particular table.

Query: 


Output: 

As you can see, the output for this INSERT query is huge! It has been split up into 8 different queries and form as part of a batch. Each part of the batch has a percentage at the top to aid the developer to see what part of the batch is slowing the query down. In this instance, the INSERT fires a trigger which opens a cursor to determine if a new row has been added. If so, then it generates a new Full Record Number for the new row (which is easier to display that a unique identifier). As you can see though, opening the cursor to retrieve the next AssetID is actually 19% of the entire batch of 8 queries, which is quite large. 


UPDATE (Simple)

This is just a simple UPDATE statement performed against as table which will have no impact on any other processes in the database.

Query: 


Output: 

As you can see, the majority of the query cost does towards searching for the type name.


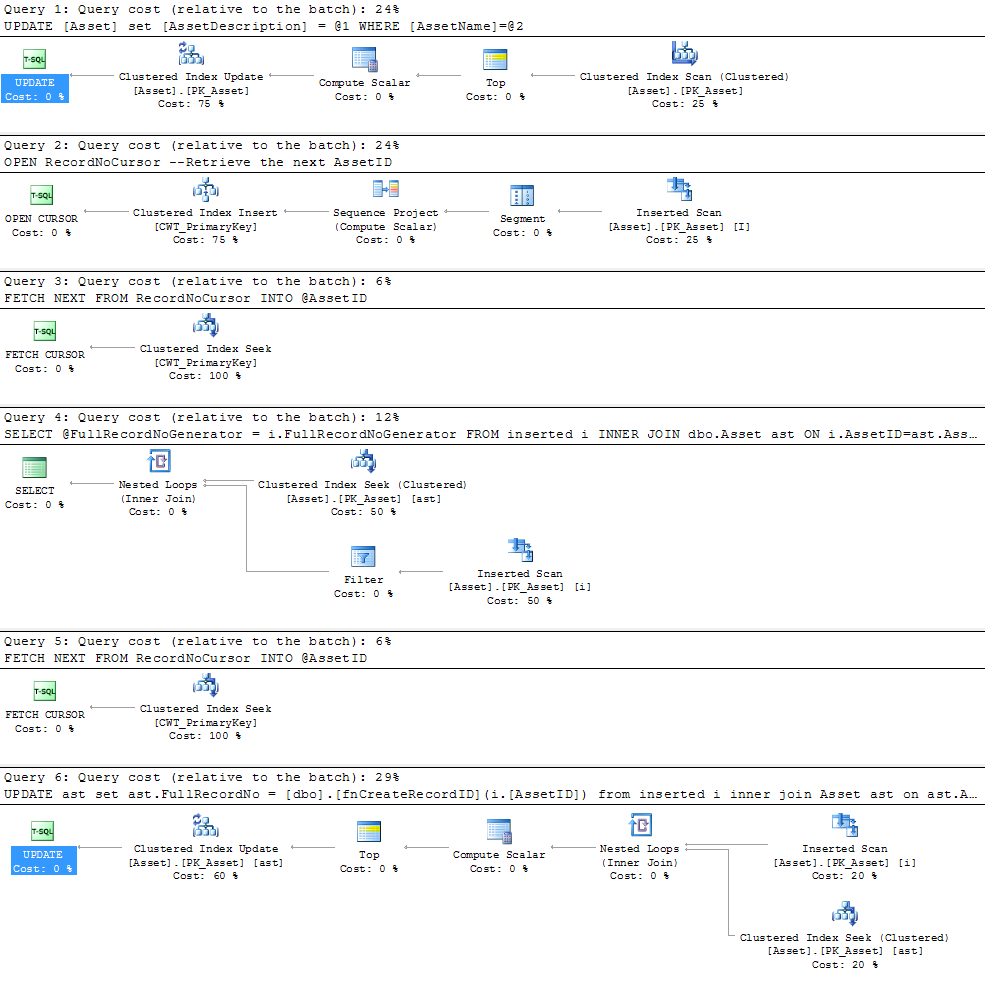
UPDATE (Complex with Stored Procedures attached)

Now let's take a look at an UPDATE statement which has other implications attached to it that run as a direct result of updating that particular table.

Query: 


Output: 

Similarly to the INSERT statement that has been performed against the same table, the output has had to be broken down into subqueries as part of a batch.


DELETE 

The following query performs a DELETE on an Asset.

Query: 


Output: 

Despite how short the DELETE query is, it still takes up quite a few resources when it is run against the database.


Overall

Overall, Execution Plans are a great visual way of telling what could be reducing the speed of your queries. If you keep an eye on the items listed in this blog post and return Execution Plans for the core functions of your database, you should be able to determine where your issues lie pretty quickly.

What Next...

Now that the we have looked at Execution Plans and can analyse them to determine where potential problems lie, tomorrow I will be discussing best practices for reducing the query cost as much as possible.

As A Final Word...

Thank you for reading today's blog post! If you have any questions/comments/feedback, please leave them in the comments section below and I will get back to you as soon as I can. Alternatively, please like my SQL Genius Facebook Page and leave a message on there.

0

Query Tuning (Part 2 - Query Execution Order)

Posted by Danielle Smith on 15:14 in
Hi everyone! Today's blog post will be focused around Query Execution Order and is part of my Query Tuning series.

You can find Part One here:

Query Tuning (Part 1 - Evaluating Query Performance)

It may surprise you that queries aren't executed in the order that they appear on screen (reading from left to right) but in a set order. It's very important to know the order of execution as a developer because you need to understand what the query is running before you can think about optimising it to increase performance.

The Query Execution Order is referred to as Theoretical because Tuning Query Performance may alter the execution order itself in order to optimise performance.

What has to be noted is that the UNION keyword has an impact on the execution order as well, because the UNION query returns the TOP n number of items before it is sorted.

See below 2 grids showing the theoretical execution order, one with UNION and one without (thanks to Microsoft for providing similar articles in your book Microsoft SQL Server 2008 - Database Developer Training Kit: MCTS Exam 70-433 p 196-197, ISBN: 978-0-7356-2639-3)

WITHOUT UNION 


WITH UNION 


What Next...

Now that the analysis of the query has been done, tomorrow I will be talking about Graphical Execution Plans and how to interpret them to work out what's actually slowing your queries down. 

As A Final Word...

Thank you for reading today's blog post! If you have any questions/comments/feedback, please leave them in the comments section below and I will get back to you as soon as I can. Alternatively, please like my SQL Genius Facebook Page and leave a message on there.

0

Query Tuning (Part 1 - Evaluating Query Performance)

Posted by Danielle Smith on 15:36 in
Good afternoon everyone! Today's blog post is going to focus on Query Performance. It's all well and good creating queries that return the correct data. However, queries may need to be optimised if it's taking a long time to retrieve those results. As a rule of thumb, you really don't want your end users to be waiting more than 30 seconds for their data to appear. This blog post will mark the start of another series discussing ways you can improve the quality of your queries, and therefore also improving the performance. 

Measuring the performance of your database queries is one of the most important aspects of designing and creating your database. This is so that you can fine tune and tweak parts of it in order to make it run better, and to:

  • Increase the scalability of the database. 
  • Increase the speed at which data is returned to the application.

When measuring the performance of your database queries, you should consider the 3 main metrics:
  • Query Cost
  • Page Reads
  • Query Execution Time

Query Cost

Query cost takes into account: 

  • CPU Resources being used by the query.
  • I/O (Input/Output) Resources being used by the query.

Generally speaking, the lower the query cost, the better the performance of the query. Sounds simple right?.. However! Query cost can only be used as an estimated guideline because:

  1. It doesn't take into account any waiting time for locks.
  2. It doesn't take into account any time for freeing up resources on the server. 
  3. It doesn't take into account User Defined Functions or CLR routines. 

Therefore as a result, it means that the query cost could be predicted much lower compared to what the actual query cost is. Despite this, the query cost is a relatively reliable estimation.

Page Reads

Page Reads represent the number of 8KB data pages accessed by SQL Server when a query is being run. In order to retrieve this query, you can execute the following: 

SET STATISTICS IO ON 

However, are page reads a useful method of calculating your query's performance? Quite probably not because:

  1. It doesn't take the amount of CPU resources used into consideration. 
  2. It doesn't take into account User Defined Functions or CLR routines either. You will notice when you use SET STATISTICS IO ON, the returning result set will have no mention of any UDFs or CLR routines. 

Query Execution Time

The length of time it takes for a query to run can be impacted by both locking and the battle for using resources, which may produce some very varied results depending on the activity on the server when the transactions are executed.

If you want to see the execution time for each query, SET STATISTICS TIME ON returns it in milliseconds. 

Execution time is very important as (from experience) predefined time outs in the code behind have caused issues whereby data requested isn't being returned in time, and therefore producing a completely blank grid. Therefore, despite it being a potentially inconsistent method of investigating query performance, it is quite possibly one of the most reliable and shouldn't be forgotten.

Really, a combination of the 3 performance tests should be carried out to determine if a query is under performing.

I have discovered that my query is running much slower than expected, why?

Your queries could be running slow for a number of reasons, though the most common are listed below:

  • Lack of useful statistics.
  • Lack of useful indexes. 
  • Lack of useful partitioning. 
  • Slow network connection.
  • Not enough memory on the server computer for SQL Server to run.

When a query runs slowly, you should really investigate why this is the case because issues can become bigger problems as the database and its contents increase in size. Keep a note of why you think your queries are too slow and investigate further using Graphical Execution Plans and SQL Server Profiler, which I will come onto in future blog posts. 

What Next...

Stay tuned for tomorrow as I will be talking more about the order in which your queries are executed, as it may surprise you to learn that they aren't executed as you read them (from left to right) and that certain conditions make your query execute in a different order. This is very important to know before you begin using Graphical Execution Plans so you know exactly how the execution of your queries works. 

As A Final Word...

Thank you for reading today's blog post! If you have any questions/comments/feedback, please leave them in the comments section below and I will get back to you as soon as I can. Alternatively, please like my SQL Genius Facebook Page and leave a message on there.

Copyright © 2009 SQL Genius - Personal Development of a Junior All rights reserved. Theme by Laptop Geek. | Bloggerized by FalconHive.